Holiday healthfulness conversations are dominated by overindulgence of consumption and then, largely in reference to resolutions to do better, physical activity, and exercise aspirations. Consistency was found in self-reported agreement with a series of holiday healthfulness statements, across time, holidays (Thanksgiving versus Christmas), and samples of respondents. The largest proportion of respondents displaying social desirability bias (SDB) were found in response to two statements, namely “I will consume more alcohol during the holiday season than at other times of the year” at (63–66%) and “I make it a New Year’s Resolution to lose weight” (60–63%). Cheap talk was tested as a mechanism to reduce SDB in holiday healthfulness reporting, but showed only limited efficacy compared to the control group surveyed simultaneously. Nonetheless, the consistency across time in reporting and SDB are notable in both self-reporting of health-related data and in studying a unique consumption period around the holidays. Healthcare providers and researchers alike seek to improve the accuracy of self-reported data, making understanding of biases in reporting on sensitive topics, such as weight gain and eating over the holiday season, of particular interest.


Holiday eating is frequently associated with excess. An average holiday meal in the United States is between 3000 and 4500 calories (Jampolis, 2018), while Americans, on average, eat 2481 calories per day (Rehkamp, 2016). Ma et al. (2006) found that during the fall season, daily caloric intake was 86 kcal higher than the spring. Holiday season indulgence results in an average annual gain in bodyweight between mid-November to mid-January ranging from 0.4 to 0.7 kg (Schoeller, 2014). Recommendations for limiting or decreasing holiday weight gain include weighing yourself every day (Kaviani et al., 2019), decreasing consumption by reflecting on the exercise required to counteract the calorie count (Mason et al., 2018), and increasing exercise as part of New Year’s resolutions (Hawkes, 2016). Conversely, Stevenson et al. (2013) found that exercise did not prevent holiday weight gain, and was not a significant predictor of body weight changes. Researchers are interested in the behaviors of people during the holiday season. However, due to social desirability bias (SDB), it can be difficult to assure that self-reporting on behaviors including eating, exercise, or even holiday spending, are reflective of reality.
SDB has long been recognized in psychology, being defined by Maccoby and Maccoby (1954). SDB occurs when in a subconscious effort to make themselves look better, a respondent answers a question in a way that deviates from their true behavior towards a real or perceived socially “correct” answer (Maccoby and Maccoby, 1954; Fisher, 1993). Many ways to combat this pervasive SDB phenomenon have been established. Post data collection calibration methods for SDB include the use of the Marlowe–Crowne Social Desirability Scale, which is a set of 13 questions chosen to establish how likely a person is to express SDB (Crowne and Marlowe, 1960). Based on the scale, researchers can set a threshold by which they can estimate models to adjust results; however, these methods are complicated (Crino et al., 1983). Furthermore, the additional questions involved in measuring SDB lengthen the survey instrument and may contribute to survey fatigue, which can result in decreased response rate and data quality (Galesic and Bosnjak, 2009). Another method to combat SDB is indirect questioning. By asking respondents what they believe the average person does, the respondent is likely to project their beliefs and evaluations when responding, without the social pressure associated with revealing one’s own actions (Fisher, 1993). Fisher (1993) found that indirect questioning mitigates SDB without systematically affecting the means of questions that were not socially sensitive. This method of combating SDB has been used in a wide range of areas beyond psychology, such as the importance of environmental performance of automobiles (Johansson-Stenman et al., 2006), public goods (Lusk and Norwood, 2009), meat products (Olynk et al., 2010), and pet acquisition (Bir et al., 2018).
Various methods of combatting, or seeking to limit biases in data collection, have been developed, such as using a cheap talk statement to attempt to mitigate hypothetical bias. The term cheap talk was originally coined in game theory literature in reference to a costless transition of signals and information that does not affect the payoffs of the game (Farrell and Gibbons, 1989; Matthews et al., 1991; Farrell and Rabin, 1996). Cummings and Taylor (1999) built on that concept to determine a method to prevent hypothetical bias when asking respondents about hypothetical purchasing decisions in contingent valuation, as opposed to correcting for the bias post data collection. Their version of cheap talk is an explicit discussion of hypothetical bias through reference to budget constraints and budgetary substitutes prior to asking a respondent to make hypothetical choices (Cummings and Taylor, 1999). Inclusion of a cheap talk script in their experiments resulted in responses that were indistinguishable between hypothetical valuation and valuation questions involving actual payments (Cummings and Taylor, 1999).
The objectives of this research are (1) to evaluate the prevalence of SDB as related to holiday eating habits, with data collected between the Thanksgiving and Christmas holidays in the U.S. and (2) evaluate the impact of a cheap talk statement designed to increase awareness of SDB, and mitigate its impact, prior to the presentation of SDB prone questions. There are likely differences in the prevalence of SDB and potential impact of a cheap talk statement for different subjects. Holiday eating habits were chosen for this analysis because there were two recent studies conducted using identical statements to measure SDB to which these results could be directly compared too. Additionally, holiday eating and New Years resolution setting in the U.S. remain topics with consistent social interest, providing a good first measure for the cheap talk experiment. The benefits of a cheap talk statement for SDB mitigation would include decreasing the need for post-data collection adjustments for SDB or the inclusion of SDB scale establishment questions which would lengthen survey instruments and contribute to fatigue of respondents.
The full sample, and the two subsamples (cheap talk and no cheap talk, henceforth control) all had higher proportions of respondents with residence in the South, and lower proportions of respondents from the Midwest or West, and did not graduate from high school when compared to the U.S. population via the U.S. Census (U.S. Census Bureau, 2016) (Table 1). The full sample had lower percentages of respondents who were male when compared to the U.S. population targets. The full sample and the cheap talk subsample had a lower proportion of people aged 25–34 when compared to the U.S. population. There was a higher percentage of respondents who attended college, Associates or Bachelor’s Degree earned when compared to the U.S. population targets. Between the two subsamples, statistical differences were found between the percentage of respondents with an income of $0–$24,999 and those aged between 55 and 64 years of age.


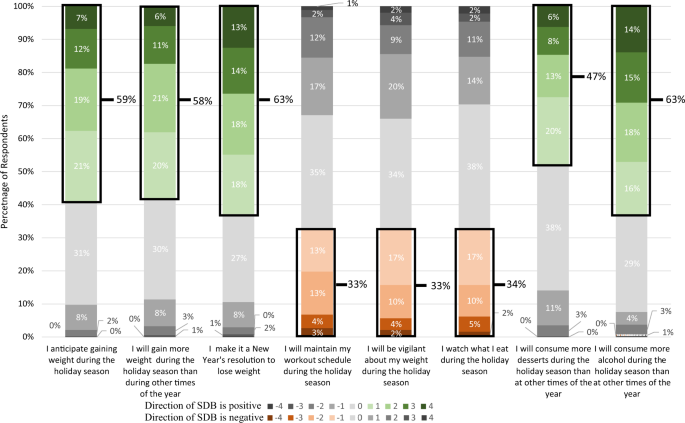
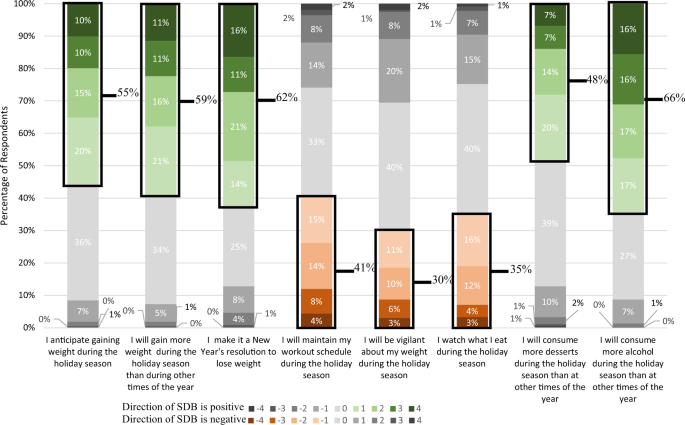
Table 5 Comparison of percentage of respondents with SDB scores between current sample and previous publications, box indicates direction of SDB.
In addition to reporting the percentage of respondents who exhibited SDB, Widmar et al. (2016) and Bir et al. (2020) reported the percentage of respondents with spreads of −4 to −3, −2 to −1, 0, 1 to 2, and 3 to 4. The percentage of respondents in each sample who had spreads between self versus the average American were statistically compared to the cheap talk sample and the control sample from this study (Table 5). Focusing specifically on the direction of SDB, either negative or positive scores depending on the statement, there were 7 incidences of statistical differences between the proportion of respondent within a particular spread between the control sample and either the Widmar et al. (2016) sample or the Bir et al. (2020) sample. No discernable pattern emerged regarding whether there were higher of lower percentages of respondents in each SDB spread categories. When comparing the cheap talk sample to Widmar et al. (2016) and Bir et al. (2020), there were four SDB indicating spreads that were statistically different in the proportion of respondents that were in that spread. For the statement “I will maintain my workout schedule during the holiday season”, lower percentages of respondents scored −4 to −3 when compared to the Widmar et al. (2016) and Bir et al. (2020) samples. Additionally, lower percentages of respondents scored −2 to −1 when compared to the Bir et al. (2020) sample.
Evaluating SDB occurrences more broadly, when considering the percentage of respondents who exhibit SDB, few differences are found across studies. A smaller proportion of respondents exhibited SDB, as defined as having an SDB score of less than −1 for the statement “I will maintain my workout schedule during the holiday season” in the current cheap talk sample when compared to Widmar et al. (2016) and Bir et al. (2020). The proportion of respondents who exhibited SDB was also lower in the current cheap talk sample for the statement “I watch what I eat during the holiday season” when compared to the Bir et al. (2020) sample. For the control sample, proportions of respondents were statistically different than Bir et al. (2020) and Widmar et al. (2016) for the statement “I anticipate gaining weight during the holiday season”. A lower percentage of respondents in the control sample exhibited SDB for the statement “I will be vigilant about my weight during the holiday season” when compared to Bir et al. (2020). Overall, given that these studies span 4 years and 4 samples, and two holidays, the level of consistency in SDB occurrences is notable.
Due to the holiday-associated nature of this study, the precision timing afforded by online surveys was instrumental. The comparison between demographics, shopping behavior, and holiday spending indicates that it is unlikely that there are systematic differences between the two subsamples. Subsample characteristics were also statistically compared to determine if there were systematic differences by Rotko et al. (2000) in a study of European air pollution. The amount of money spent during the holidays is notoriously difficult to determine. The holiday shopping season, as defined in the U.S. as the time between Thanksgiving and Christmas, can vary from 26 to 32 days with large impacts on holiday spending (Basker, 2005). Each additional day results in ~$6.50 in spending, mostly attributed to impulse purchases (Basker, 2005). Byrnes (2019) stated that on average people in the U.S. would spend nearly $1050 on gifts, goodies, and travel. This is much higher than the combined averages found in this study. However, Byrnes (2019) was using data from the National Retail Federation, in self-stated data, such as the results of this study, people may be under-estimating the amount spent, or may have trouble remembering all purchases made. Although there is social pressure to spend during the holiday season spurred by the idea of gifts as expressions of love (Spector, 2018), there is also social pressure to mitigate spending, as exhibited by the many advice articles and books regarding not overspending (Spector, 2018; Epperson and Dickler, 2019; Karp, 2010).
Evidence of SDB in self-reporting holiday healthfulness-related behaviors was found, which is unsurprising in itself, although perhaps notable for the consistency with which it was documented over time in this analysis along with those of Widmar et al. (2016) and Bir et al. (2020). The literature provides ample evidence of SDB in self-reported health behaviors and outcomes, including both underreporting negatives and over-reporting positive behaviors. Hébert et al. (2001) found that women with college educations working in the health system tended to underreport caloric intake and Simons et al. (2015) found an underreporting of sedentary gaming hours among non-active videogame playing youths. Klesges et al. (2004) found that overestimates of self-reported activity, underestimates of sweetened beverage preferences, and lower ratings of weight concerns and dieting behaviors were related to SDB in 8–10-year-old girls. They suggested more research into the role of SDB in complicating relationships observed between self-reported diet and/or physical activity and health outcomes was needed. Adams et al. (2005) suggested that SDB led to an over reporting of physical activity among women in self-reported data.
The use of cheap talk to mitigate the percentage of respondents exhibiting SDB was only effective for one of the eight holiday statements studied. Additionally, the inclusion of the cheap talk statement resulted in fewer statistical differences between the average self-score of all respondents compared to the score assigned to the average American. This decrease in statistical difference between self and average American indicates that steps towards convergence of the average American and the self-reported score was occurring for more than just one statement. Despite this only mild success rate, the incidences of SDB did not increase due to the inclusion of the cheap talk statement. The use of cheap talk to prevent hypothetical bias as introduced by Cummings and Talyor (1999) experienced mixed results when being used with other products and scenarios. List (2001) found that the cheap talk script for hypothetical bias did not work on experienced bidders. Champ et al. (2009) found that the hypothetical script only worked for some offer amounts, and did not work on experienced bidders. Previous work has evaluated SDB in other health or food-related contexts for other regions of the world. Bergen and Labonte (2020) evaluated SDB in neonatal and child health care use in Ethiopia. Their identification strategy included using common cues, the nature of responses and choice patterns. They warned that SDB is influenced by accepted attitudes and behaviors, social position and affluence. Studying food-purchasing behaviors in Australia, Wheeler et al. (2019) found that SDB influenced responses regarding the purchase of organic food, increasing self-reported purchasing frequency. They found while accounting for SDB that respondents were motivated to purchase organic for non-selfish reasons including environmental and public good. The effectiveness of such tangentially related health and food-related questions in other countries would be an interesting extension of this work.
To further provide evidence of the prevalence and consistency of incidences of SDB in holiday eating and exercise-related statements, few differences were found between the SDB results of this study, Widmar et al. (2016) and Bir et al. (2020). The consistency of responses across samples and time is noteworthy for those studying holiday health. The few statistical differences found between the cheap talk subsample and the previous samples were mostly towards decreasing the percentage of respondents who exhibited SDB. The decrease in SDB also supports the idea that incorporating a cheap talk statement prior to SDB-sensitive questions may result in a mild decrease of incidences of SDB. Limited evidence of cheap talk reducing SDB in sensitive questions related to holiday eating and healthfulness was found. However, notable consistency across time, samples of respondents, and holidays (Christmas versus Thanksgiving) in terms of both responses and SDB exhibited was documented.
Although the demographics of the full sample and subsamples closely mirrored the U.S. population, there were some statistical discrepancies. The samples of online survey respondents are often overeducated (Szolnoki and Hoffmann, 2013). However, the benefits of online data collection, including short completion time and affordable implementation, are often thought to outweigh this shortcoming (Louviere et al., 2000; Gao et al., 2009).
The use of cheap talk to mitigate the percentage of respondents exhibiting SDB was only effective for one of the eight holiday statements studied. The use of cheap talk to mitigate SDB may be more successful for other SDB prone questions, aside from the holiday-focused statements investigated here. It may simply be that the prevalence of SDB in the holiday eating and exercise statements is so engrained that the cheap talk statement had minimal effect. Or, perhaps there is an inherent difference in holiday-related reporting for the various cultural, economic, and social reasons which holiday spending and celebrations are so wrought with debate. Further research implementing cheap talk for other SDB prone questions could shed light on which situations this type of intervention works to mitigate SDB.
The research project #60460205 was approved by the Purdue University institutional review board. Informed consent was obtained by all participants. Data collection took place during the peak of the 2018 holiday season, with data collection occurring December 18–26, 2018 to correspond with the winter holiday season surrounding Christmas Day (December 25) in the U.S. due to the holiday dinning and health-related questions specific to this data collection effort. Kantar, a company which hosts a large opt-in panel database (Kantar, 2020), was used to obtain the survey respondents, who were required to be 18 years of age or older to participate. Quotas set within Qualtrics, an online survey tool (Qualtrics, 2020), were used to target the proportion of respondents to match the U.S. census proportions for gender, age, education, income, and region of residence (U.S. Census Bureau, 2016). The test of proportions was used to evaluate if there were statistical differences between the subsamples employed in this study, as well as between each of the subsamples and the U.S. census. The one and two tailed tests of population proportion, assuming a normal distribution is calculated as
$$z = \frac> \right)>>> >>,$$where p0 is the hypothesized proportion (for example the census percentage), \(\widehat P\) is the sample proportion, and n is the sample size (Acock, 2018). Equation (1) was used to compare each subsample to the U.S. population. A test of the difference of two proportions \(\widehat P_1\) and \(\widehat P_2\) , for example comparing the demographics of the two subsamples, can be calculated as